
2 in 3 Malays and 3 in 5 Indians have faced discrimination at some point while applying for jobs: study finds
(from Newzzit; the original story is here http://newzzit.com/stories/2-in-3-malays-and-3-in-5-indians-have-faced-discrimination-at-some-point-while-applying-for-jobs-study-finds)
Quick Summary
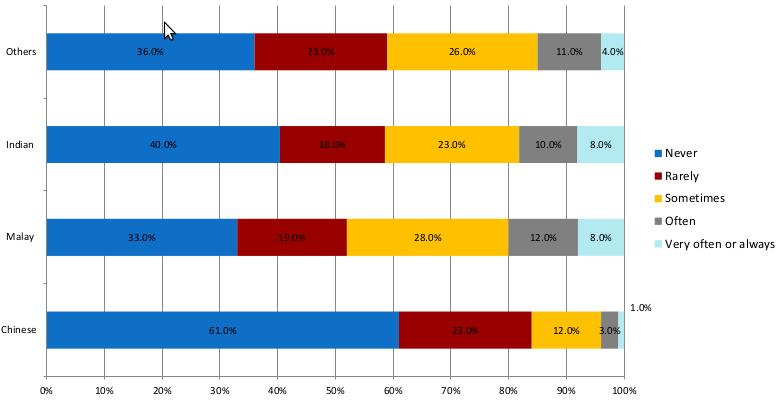
While 33% Malays said that they have never faced racial discrimination in Singapore when applying for a job, 19% said they faced it rarely, 28% sometimes, 12% often and 8% said they always faced it. For Indians, these percentages are: 40% never, 18% rarely, 23% sometimes, 10% often and 8% always. Combining the above data illustrates that 2 in 3 Malays and 3 in 5 Indians have faced discrimination at least at some point while applying for jobs in Singapore.

Thisemerged under the “Perception of Discrimination” indicator of arecent survey report published by the Institute of Policy Studies(IPS),National University of Singapore (NUS), and OnePeople.sg,an organisation to promote racial harmony and bring differentcommunities together in Singapore. The indicator was to “measureperceived discrimination by examining whether Singaporeans feel thatthey receivedifferentialtreatment as a result of race in publicservices– such as in hospitals or at police stations – aswellas in their daily lives – while using public transport,orat work”.
Thesurvey which was conducted to gauge the country's progress inbuilding harmonious racial and religious relations covered 4,131Singapore residents. While the indicators were released to the publicon the July 18, 2013, the details of the survey were provided inSeptember at a jointforumwhere participants reflected on race and religious relations inSingapore. (See Table 1)
In job promotions
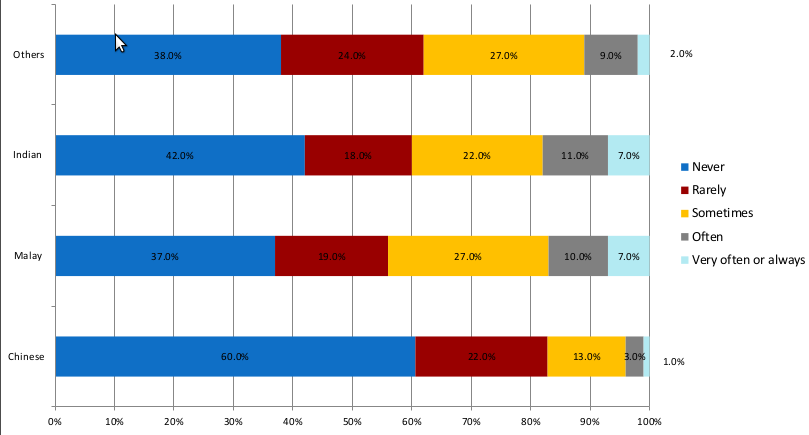
When the surveyors asked the respondents “How often do you feel racially discriminated when being considered for a job promotion?”, the results were similar.
While 37% Malays said that they had never faced such discrimination, 19% said they faced it rarely, 27% sometimes, 10% often and 7% always. For the Indian community, while 42% had never faced discrimination in promotions, 18% faced it rarely, 22% sometimes, 11% often, and 7% said they have always faced it. (See Table 2)
“Perception of social exclusion”
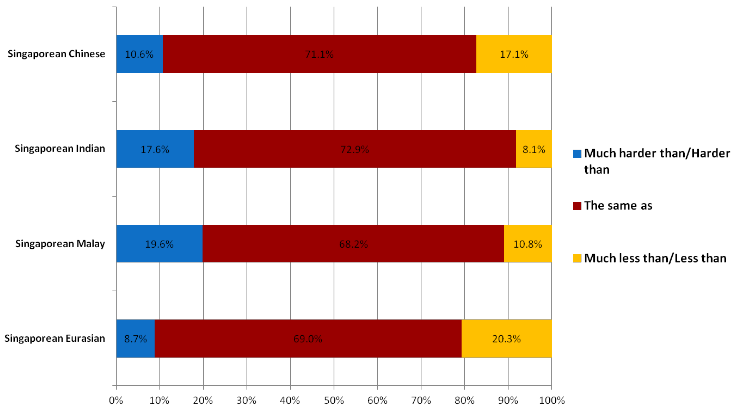
The survey also used an indicator, “Perception of social exclusion”, to “examine whether Singaporean’s perceive that particular segments of the population have to work harder to achieve a decent life in Singapore and whether access to top positions were more difficult for them to achieve”. And its findings are also interesting.
About 17.6% Singaporean Indian respondents and 19.6% Singaporean Malays believed that Indians and Malays had to work harder compared to other races to have a basic, decent life in Singapore. (See Table 3)
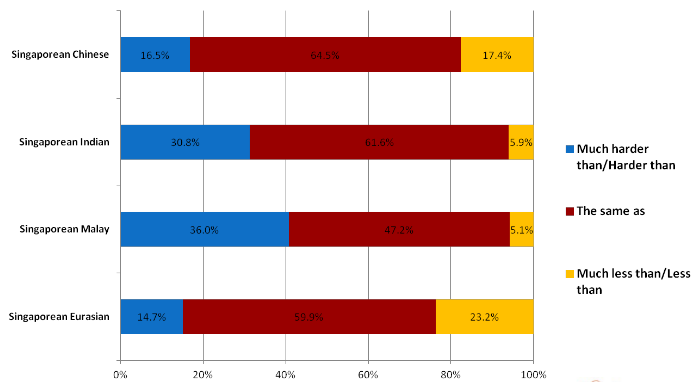
Likewise, about 30.8% Singaporean Indian respondents and 36% Singaporean Malays believed that Indians and Malays had to work harder compared to other races to reach top positions in their organisations. (See Table 4)
The report also highlighted general trends from the data collected, and provided a baseline study that will allow tracking the state of racial and religious relations in Singapore over the years. “Minority respondents compared to Chinese respondents held more positive attitudes towards embracing diversity, colour blindness, inter-cultural understanding, social acceptance and cross-racial friendships. This is expected since minorities are more likely to be sensitive to issues surrounding diversity. Similarly those who were younger, better educated and were of higher socio- economic status tended to be more positive.”
“Discrimination was more often perceived by minorities, those who were less educated, from lower socio-economic status backgrounds and who were younger,” the authors concluded.
Note: All graphs in this story are courtesy IPS and OnePeople.sg